Lösung 1.3:2c
Aus Online Mathematik Brückenkurs 2
| (Der Versionsvergleich bezieht 8 dazwischen liegende Versionen mit ein.) | |||
| Zeile 1: | Zeile 1: | ||
| - | + | Lokale Extremstellen einer Funktion sind entweder: | |
| - | + | # stationäre Stellen mit <math>f^{\,\prime}(x)=0</math>, | |
| - | <math> | + | # singuläre Stellen, in denen die Funktion nicht differenzierbar ist, oder |
| + | # Randstellen. | ||
| + | |||
| + | Da die Funktion ein Polynom ist, ist sie überall definiert und überall differenzierbar. Also gibt es keine Extremstellen, die die Bedingungen 2 und 3 erfüllen. | ||
| - | + | Die Ableitung null gesetzt, ergibt folgende Gleichung | |
| - | + | {{Abgesetzte Formel||<math>f^{\,\prime}(x) = 6x^2+6x-12 = 0\,\textrm{.}</math>}} | |
| - | + | Dividieren wir durch 6 erhalten wir durch quadratische Ergänzung | |
| - | + | ||
| - | + | ||
| - | + | ||
| - | + | {{Abgesetzte Formel||<math>\Bigl(x+\frac{1}{2}\Bigr)^2 - \Bigl(\frac{1}{2}\Bigr)^2 - 2 = 0\,\textrm{.}</math>}} | |
| - | <math>1</math> | + | |
| + | Und wir erhalten die Gleichung | ||
| - | <math> | + | {{Abgesetzte Formel||<math>\Bigl(x+\frac{1}{2}\Bigr)^2 = \frac{9}{4}</math>}} |
| - | + | mit den Lösungen | |
| - | + | ||
| - | + | ||
| + | {{Abgesetzte Formel||<math>\begin{align} | ||
| + | x &= -\frac{1}{2}-\sqrt{\frac{9}{4}} = -\frac{1}{2}-\frac{3}{2} = -2\,,\\[5pt] | ||
| + | x &= -\frac{1}{2}+\sqrt{\frac{9}{4}} = -\frac{1}{2}+\frac{3}{2} = 1\,\textrm{.} | ||
| + | \end{align}</math>}} | ||
| - | <math> | + | Die Funktion hat also die stationären Stellen <math>x=-2</math> und <math>x=1</math>. |
| - | + | Wir erstellen eine Vorzeichentabelle und erhalten so die Extremstellen. | |
| + | {| border="1" cellpadding="5" cellspacing="0" align="center" | ||
| + | |- | ||
| + | |width="50px" align="center" style="background:#efefef;"| <math>x</math> | ||
| + | |width="50px" align="center" style="background:#efefef;"| | ||
| + | |width="50px" align="center" style="background:#efefef;"| <math>-2</math> | ||
| + | |width="50px" align="center" style="background:#efefef;"| | ||
| + | |width="50px" align="center" style="background:#efefef;"| <math>1</math> | ||
| + | |width="50px" align="center" style="background:#efefef;"| | ||
| + | |- | ||
| + | |width="50px" align="center"| <math>f^{\,\prime}(x)</math> | ||
| + | |width="50px" align="center"| <math>+</math> | ||
| + | |width="50px" align="center"| <math>0</math> | ||
| + | |width="50px" align="center"| <math>-</math> | ||
| + | |width="50px" align="center"| <math>0</math> | ||
| + | |width="50px" align="center"| <math>+</math> | ||
| + | |- | ||
| + | |width="50px" align="center"| <math>f(x)</math> | ||
| + | |width="50px" align="center"| <math>\nearrow</math> | ||
| + | |width="50px" align="center"| <math>21</math> | ||
| + | |width="50px" align="center"| <math>\searrow</math> | ||
| + | |width="50px" align="center"| <math>-6</math> | ||
| + | |width="50px" align="center"| <math>\nearrow</math> | ||
| + | |} | ||
| - | + | Die Funktion hat also ein lokales Maximum an der Stelle <math>x=-2</math> und ein lokales Minimum an der Stelle <math>x=1</math>. | |
| - | + | ||
| - | + | ||
| - | + | ||
| - | + | ||
| - | + | ||
| - | <math>x | + | |
| - | + | ||
| - | + | ||
| - | <math>x | + | |
| - | + | ||
| - | + | ||
| - | + | ||
| - | + | ||
| - | + | ||
| - | + | ||
| - | + | ||
| - | + | ||
| - | + | ||
| - | + | ||
| - | + | ||
| - | + | ||
| - | + | ||
| - | + | ||
| - | + | ||
| - | + | ||
| - | + | ||
| - | + | ||
| - | + | ||
| - | + | ||
| + | Berechnen wir die Funktionswerte von einigen Stellen, können wir mit Hilfe der Vorzeichentabelle die Funktion zeichnen. | ||
[[Image:1_3_2_c.gif|center]] | [[Image:1_3_2_c.gif|center]] | ||
Aktuelle Version
Lokale Extremstellen einer Funktion sind entweder:
- stationäre Stellen mit \displaystyle f^{\,\prime}(x)=0,
- singuläre Stellen, in denen die Funktion nicht differenzierbar ist, oder
- Randstellen.
Da die Funktion ein Polynom ist, ist sie überall definiert und überall differenzierbar. Also gibt es keine Extremstellen, die die Bedingungen 2 und 3 erfüllen.
Die Ableitung null gesetzt, ergibt folgende Gleichung
| \displaystyle f^{\,\prime}(x) = 6x^2+6x-12 = 0\,\textrm{.} |
Dividieren wir durch 6 erhalten wir durch quadratische Ergänzung
| \displaystyle \Bigl(x+\frac{1}{2}\Bigr)^2 - \Bigl(\frac{1}{2}\Bigr)^2 - 2 = 0\,\textrm{.} |
Und wir erhalten die Gleichung
| \displaystyle \Bigl(x+\frac{1}{2}\Bigr)^2 = \frac{9}{4} |
mit den Lösungen
| \displaystyle \begin{align}
x &= -\frac{1}{2}-\sqrt{\frac{9}{4}} = -\frac{1}{2}-\frac{3}{2} = -2\,,\\[5pt] x &= -\frac{1}{2}+\sqrt{\frac{9}{4}} = -\frac{1}{2}+\frac{3}{2} = 1\,\textrm{.} \end{align} |
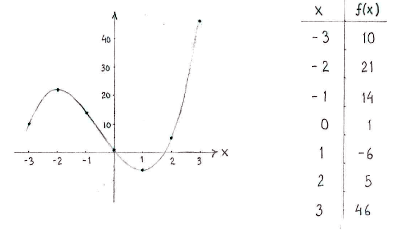
Die Funktion hat also die stationären Stellen \displaystyle x=-2 und \displaystyle x=1.
Wir erstellen eine Vorzeichentabelle und erhalten so die Extremstellen.
| \displaystyle x | \displaystyle -2 | \displaystyle 1 | |||
| \displaystyle f^{\,\prime}(x) | \displaystyle + | \displaystyle 0 | \displaystyle - | \displaystyle 0 | \displaystyle + |
| \displaystyle f(x) | \displaystyle \nearrow | \displaystyle 21 | \displaystyle \searrow | \displaystyle -6 | \displaystyle \nearrow |
Die Funktion hat also ein lokales Maximum an der Stelle \displaystyle x=-2 und ein lokales Minimum an der Stelle \displaystyle x=1.
Berechnen wir die Funktionswerte von einigen Stellen, können wir mit Hilfe der Vorzeichentabelle die Funktion zeichnen.

