Lösung 2.2:7a
Aus Online Mathematik Brückenkurs 1
(Unterschied zwischen Versionen)
K |
|||
| Zeile 1: | Zeile 1: | ||
| - | The graph of the linear function | + | The graph of the linear function <math>y=3x-2</math> is a straight line which has a slope of 3 (the coefficient in front of the ''x'') and cuts the ''y''-axis at <math>y=-2</math>. |
| - | <math>y=3x-2</math> | + | |
| - | is a straight line which has a | + | |
| - | + | ||
| - | (the coefficient in front of the | + | |
| - | + | ||
| - | ) and cuts the | + | |
| - | + | ||
| - | -axis at | + | |
| - | <math>y=-2</math>. | + | |
| - | + | [[Image:2_2_7_a.gif|center]] | |
| - | [[Image:2_2_7_a.gif|center]] | + | |
| - | + | ||
| - | + | ||
Version vom 13:33, 24. Sep. 2008
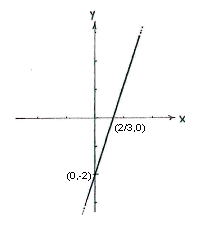
The graph of the linear function \displaystyle y=3x-2 is a straight line which has a slope of 3 (the coefficient in front of the x) and cuts the y-axis at \displaystyle y=-2.

