Lösung 2.3:8a
Aus Online Mathematik Brückenkurs 1
(Unterschied zwischen Versionen)
K |
|||
| Zeile 6: | Zeile 6: | ||
|align="center"|[[Image:2_3_8_a-1.gif|center]] | |align="center"|[[Image:2_3_8_a-1.gif|center]] | ||
| width="10px"| | | width="10px"| | ||
| - | |align="center"|[[Image:2_3_8_a- | + | |align="center"|[[Image:2_3_8_a-2.gif|center]] |
|- | |- | ||
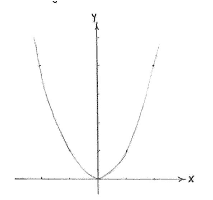
|align="center"|<small>The graph of ''f''(''x'') = ''x''²</small> | |align="center"|<small>The graph of ''f''(''x'') = ''x''²</small> | ||
Version vom 12:30, 29. Sep. 2008
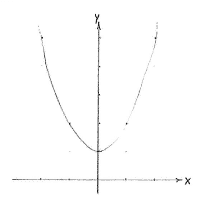
The curve \displaystyle y=x^{2} is a parabola with a minimum at the origin according to the figure below on the left and, compared with that curve, \displaystyle y=x^{2}+1 is the same curve but with the number 1 added to the y-coordinate of each point, i.e. the parabola is shifted one unit up in the y-direction.
| The graph of f(x) = x² | The graph of f(x) = x² + 1 |


